- The five-fold expansion of global population since 1850 has been made possible by non-renewable fuels, the consumption of which pervades all aspects of society –food, transportation, communication etc. (Before 1850 population growth was relatively flat.)
- The eight-fold expansion of global per capita energy consumption since 1850 has been entirely a result of consumption of non-renewable energy. (Oil, and then natural gas, made cheap goods possible.)
- North America consumes a disproportionate amount of energy (5 times the global per capita average). The Developing World understandably aspires to North American energy consumption levels; however, finite non-renewable resources are unlikely to be sufficient to allow this to happen, setting the stage for global conflict over energy. (This will lead to paralysis in addressing global warming.)
- The realities of the finite nature of non-renewable energy resources are now becoming evident –peak oil in many producing countries, peak North American natural gas, ten-fold increase in uranium prices since 2000, imports of coal into the US after centuries of self-sufficiency. (Peaks are defined as the point at which production begins an irreversible decline relative to demand.)
- Despite the hype, renewable energy technologies are EXTREMELY UNLIKELY to be able to replace non-renewable energy in existing business-as-usual energy demand forecasts –a sustainable future lies in radically reducing and rethinking energy consumption. (A future that few political leaders are prepared to address, thus requiring individual action and responsibility - sorry no magic bullet.)
JustShelter project news, plus news on sustainability, affordable housing, and urban design.
Monday, 24 August 2009
Limited Energy Options
Monday, 27 July 2009
Bike-Friendly Homes
Sunday, 24 May 2009
Prices are up?
Residential Sales | 2008 | 2009 | Comparison | |||||
# of Listings | Average Sale Price | # of Listings | Average Sale Price | Volume Change | Price Change |
| ||
NIAGARA-ON-THE-LAKE | 22 | 355,649 | 18 | 311,667 | 82% | 88% |
| |
NIAGARA FALLS | 131 | 178,668 | 108 | 190,735 | 82% | 107% |
| |
FORT ERIE | 61 | 180,526 | 46 | 160,699 | 75% | 89% |
| |
ST.CATHARINES | 212 | 195,595 | 142 | 194,576 | 67% | 99% |
| |
THOROLD | 30 | 190,467 | 27 | 202,848 | 90% | 107% |
| |
FONTHILL/PELHAM | 23 | 262,696 | 26 | 284,388 | 113% | 108% |
| |
WELLAND | 87 | 172,190 | 58 | 168,260 | 67% | 98% |
| |
PORT COLBORNE/WAINFLEET | 35 | 147,817 | 37 | 170,468 | 106% | 115% |
| |
LINCOLN/WEST LINCOLN | 27 | 269,306 | 31 | 255,132 | 115% | 95% |
| |
Totals | 628 | 195,684 | 493 | 198,941 | 79% | 102% |
| |
Sunday, 5 April 2009
The Best Value is Downtown
Right now I’m consulting on an AHP project located at the bleeding edge of new development. I regret the decisions that were made not to further pursue a downtown site after our initial effort. Hindsight is great and in retrospect government imposed timing conditions, project size, and the path of least resistance put us on that site. But in the long run we may have not done our residents a favour, especially as transportation costs rise.
That is a rental development, but for ownership – equity building suburban developments, the negative impacts are likely worse. It seems counter intuitive but the case made in this article is persuasive. Litman summarizes saying, “a typical household is likely to be a hundred thousand dollars wealthier in a decade if they choose a smart growth location over automobile-dependent sprawl.”
If we are going through “the great reset” as Richard Florida calls it, toward a new economy and new priorities, the Niagara Growth Strategy needs to be strengthen, not diluted by the pressures of old habits, to ensure we create the right conditions for good transportation options in our urban cores, and between the municipalities. Appreciation for high density urban living, by necessity, will evolve to be the new paradigm. Affordable rental housing efforts need to be there, involving smaller developments, multiple sites, and mixed with and in ownership housing.
Sunday, 29 March 2009
Formaldeyde and New Homes
We recently tested several new homes for formaldehyde in the air. The newest home, advertised as a “green” home, had 300 ppb of formaldehyde. Children in homes with only 30 ppb can have decreased lung function. Between 60 ppb and 120 ppb, children are more likely to have asthma and chronic bronchitis.
At 100 ppb, most adults experience eye, nose, and throat irritation.
Of homes that were less than 2 years old, every home we tested had at least 100 ppb of formaldehyde. The newer homes had 200 - 300 ppb. The 300 ppb concentration we found in the newest home is equal to the 15-minute Short Term Exposure Limit (STEL) for occupational exposures. A worker in that home should wear a respirator to remain inside the building for more than 15 minutes. An employer that exposes workers to 300 ppb of formaldehyde should have a Hazard Communication Program to inform workers about chemical hazards and ways to avoid illness.
Tuesday, 10 March 2009
OREA fails the leadership test
Wednesday, 7 January 2009
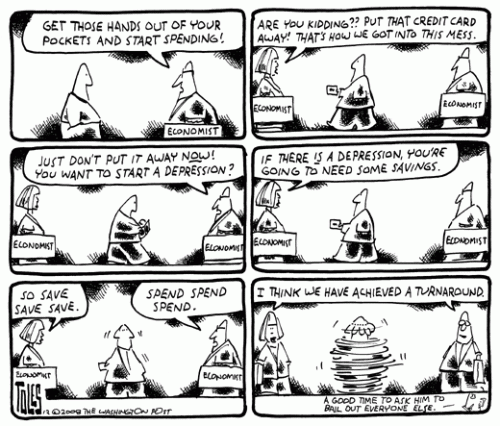
The Spend/Save Paradox
The problem is we don't have an easy understanding of what is made locally. Until we demand and attain meaningful identification of the origin of products we don't have much of a choice.
(editorial cartoon by Tom Toles, Washington Post)
Friday, 12 December 2008
Are We Really Happier as Owners?
The great dream of all is to own your own home. It supposedly is a sign of a successful life. Now with the economic downturn, maybe its time to see if that was ever really as good as it seemed. According to the Wharton School’s Grace Wong in a study of those who own their own homes. Those who own are actually less happy than those who rent. I find little evidence that homeowners are happier by any of the following definitions: life satisfaction, overall mood, overall feeling, general moment-to-moment emotions (i.e., affect) and affect at home… They are also more likely to be 12 pounds heavier, report lower a lower health status and poorer sleep quality. They tend to spend less time on active leisure or with friends. The average homeowner reports less joy from love and relationships… Contrary to popular belief, I do not find significant differences in family-related time use patterns, family-related affect, number of normal work hours, indicators of stress or measures of self-esteem and perceived control of life by homeownership …
Homeowners are happier on average only on an unadjusted basis. Once household income, housing quality and health are controlled for, they are no happier than renters. What’s more, they report to derive more pain from both the neighborhood and their house and home. This positive pain gap remains stable and robust when health, neighborhood characteristics and financial stress are controlled for. As for the most frequently cited channels of a positive impact by homeownership, namely self-esteem, stress, health and family life, again there is very little supporting evidence in my data… [H]omeowners spend less time on active leisure activities or with friends, which have been documented as some of the most enjoyable affective experiences.
Thursday, 4 December 2008
Property values holding their own
Month = Last November and This November
YTD =November to November